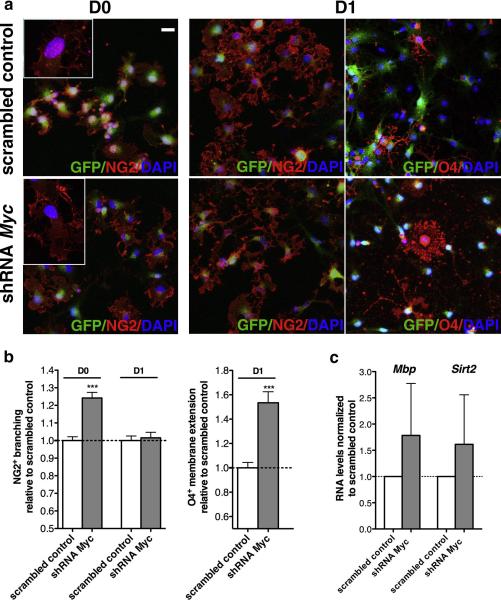
Figure 6. c-Myc silencing favors early oligodendrocyte lineage progression.
(a) c-Myc silenced cells were maintained either in proliferating condition (D0) or differentiated for 1 in the presence of T3 (D1). Proliferating mOPCs were stained for the progenitor marker NG2 (red) and for GFP (green) to visualize infected cells and counterstained with DAPI (blue). Differentiating mOPCs were stained for the progenitor marker NG2 (red) and for the lipid sulfatide recognized by the antibody O4 (red). (b) Bar graphs represent the average area occupied by NG2+ cytoplasmic processes at D0 and D1 and the O4+ membrane extension at D1, as measured by ImageJ in three independent experiments (n=3, mean ± s.e.m. *** p<0.005). (c) Effect of c-Myc silencing on the transcript levels of markers of oligodendrocyte differentiation (Mbp and Sirt2) as assessed by quantitative RT-PCR on RNA samples isolated from proliferating mOPCs after 72h post infection. Data were normalized to 18S and expressed as relative to scrambled controls. Scale bar in (a) = 20 μm.

