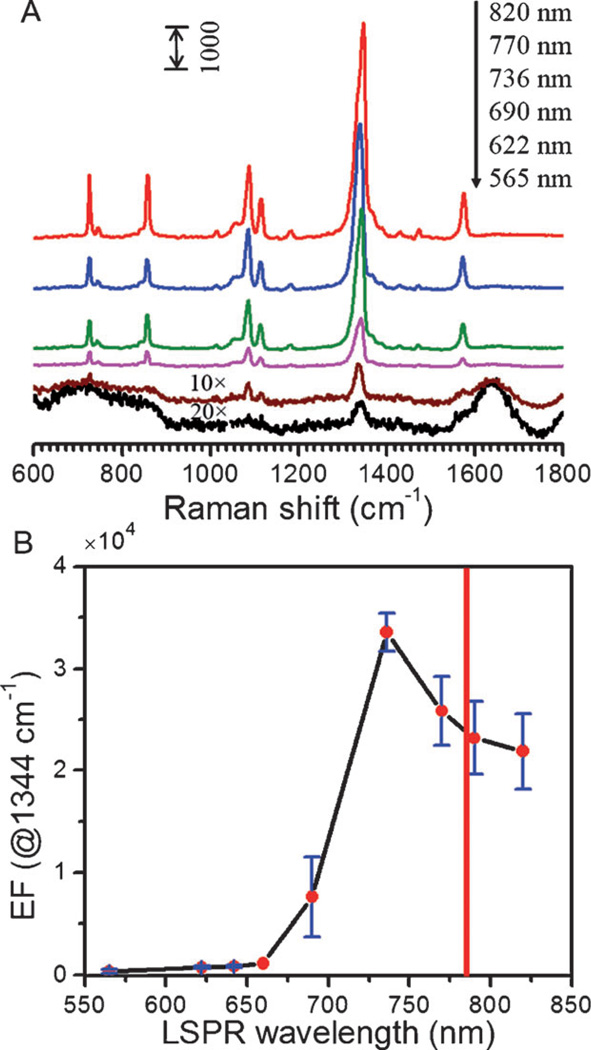
Figure 4.
LSPR-dependent SERS enhancement. A) SERS spectra of 4-NTP in the presence of gold nanostars with LSPR bands of 565, 622, 690, 736, 770 and 820 nm, respectively. Note that the SERS spectra shown in (A) have been offset vertically for clarity. SERS spectra of 565 and 622 nm gold nanostars are 20 and 10 times magnified, respectively, for plotting purposes. B) SERS EFs as a function of the LSPR wavelength of gold nanostars. The red solid line shown in (B) indicates the 785 nm laser wavelength position.

