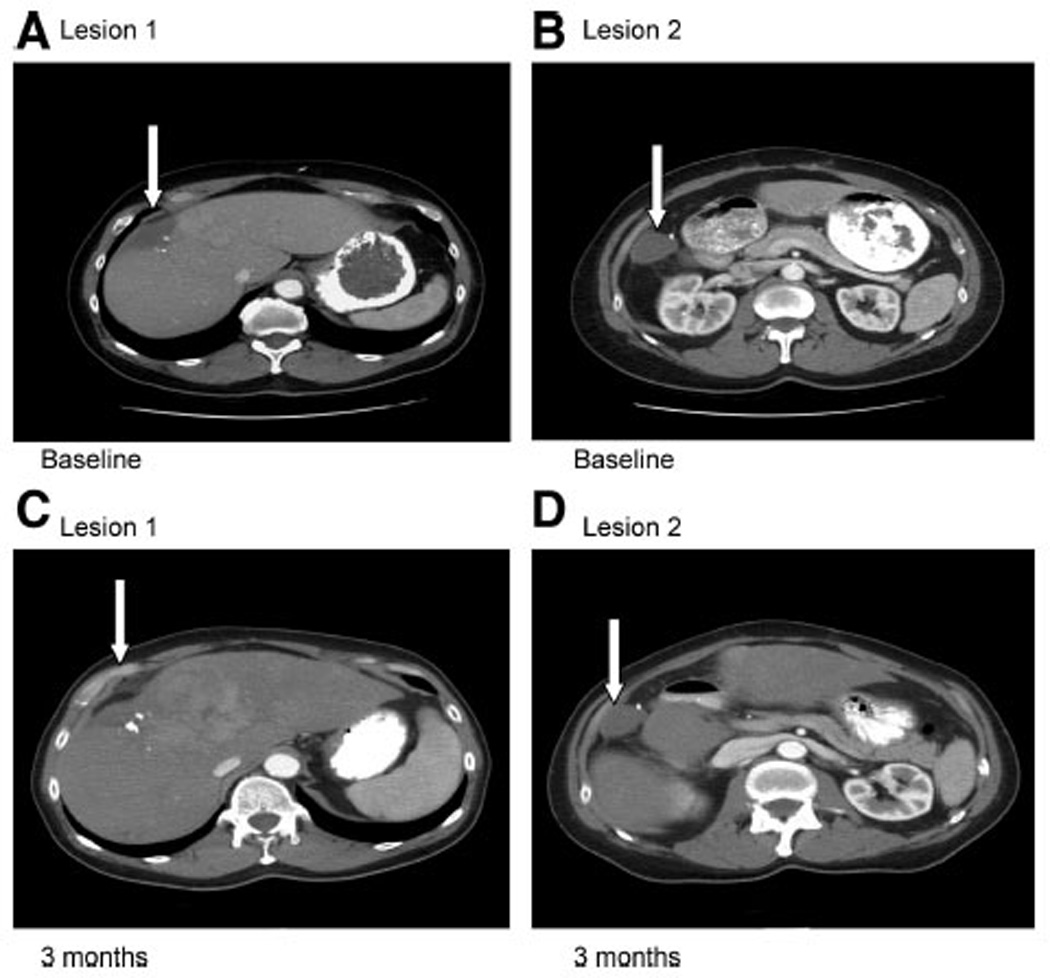
FIGURE 1.

A CT scan showing target lesions of patient with 23% reduction in tumor size. The patient had 2 target lesions in the liver (indicated by arrows). Images 1 A and B are the patient’s baseline scan. Images C and D are the restaging scans performed after 6 cycles of therapy.
