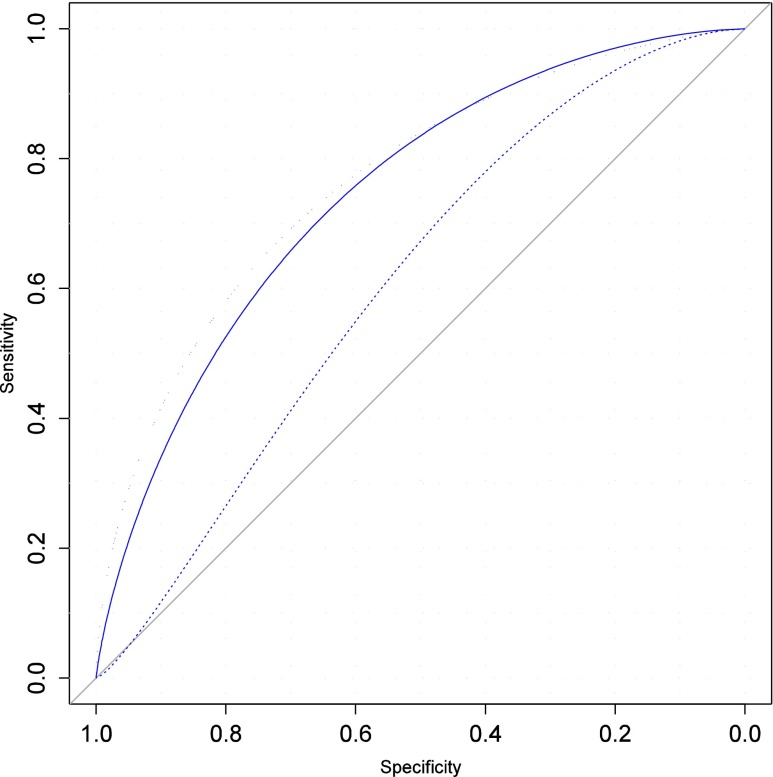
Fig. 1.
Discrimination measured by the Area under the ROC curve (AuROC), for the three models considered: strict Templeton model (auROC = 0.61, 95%CI 0.54, 0.56, dashed curve), Templeton-Arvis TMA model (AuROC = 0.76, [0.71, 0.80], dotted line), and simplified model using AMH (auROC = 0.75, [0.70, 0.80], solid line)

