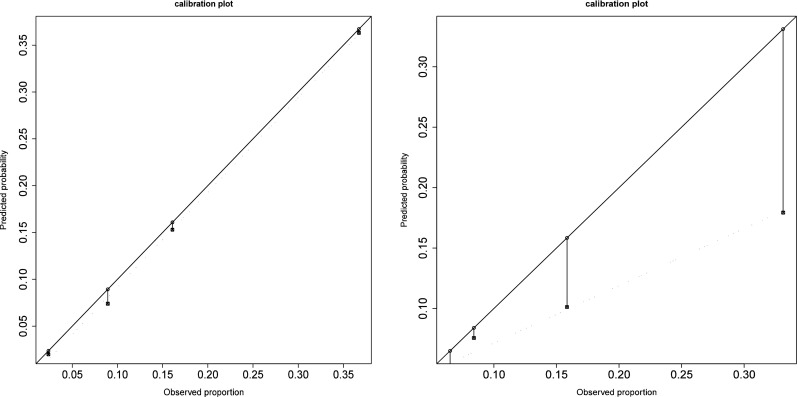
Fig. 2.

Calibration plot for the original TM model (right) and TMA fitted model (left). Ordinates and abscises represent the predicted and observed live birth probabilities, respectively, the solid line is the ideal line (meaning coincidence between observed and predicted probabilities) and the dotted line is the linear fitting based on the quartiles of the distribution observed
