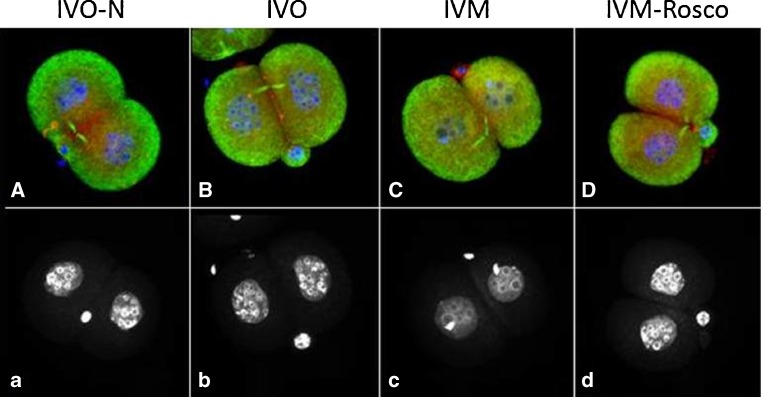
Fig. 3.
2-cell stage IVO-N, IVO, IVM and IVM-Rosco embryos labeled for tubulin (green), pericentrin (red) and chromatin (blue) (A–D), corresponding chromatin staining (a–d) depicting the number of small nucleoli on each blastomere. Note the asymmetric size of the two blastomeres of IVM 2-cell stage embryos (C) when compared to IVO (B) and IVM-Rosco (D). Also note that IVM 2-cell stage embryos (c) exhibit fewer nucleoli when compared to both IVO (b) and IVM-Rosco embryos (d), probably denoting distinct transcriptional activity

