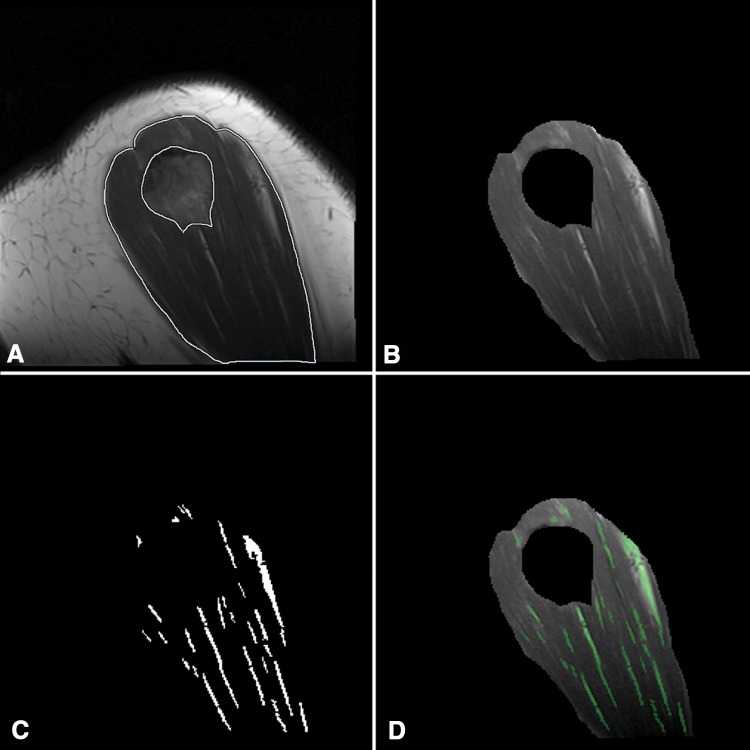
Fig. 1A–D.
Quantitative fatty infiltration was measured using sagittal T1-weighted MRI data. The (A) deltoid was outlined manually outlined by two musculoskeletal radiologists, and (B) the isolated muscle pixels were processed using a custom image analysis algorithm able to determine the differences in mean local pixel intensities to isolate (C) individual fat pixels. This processing algorithm resulted in accurate representation of the fraction of intramuscular fat, as shown by (D) overlay images.

