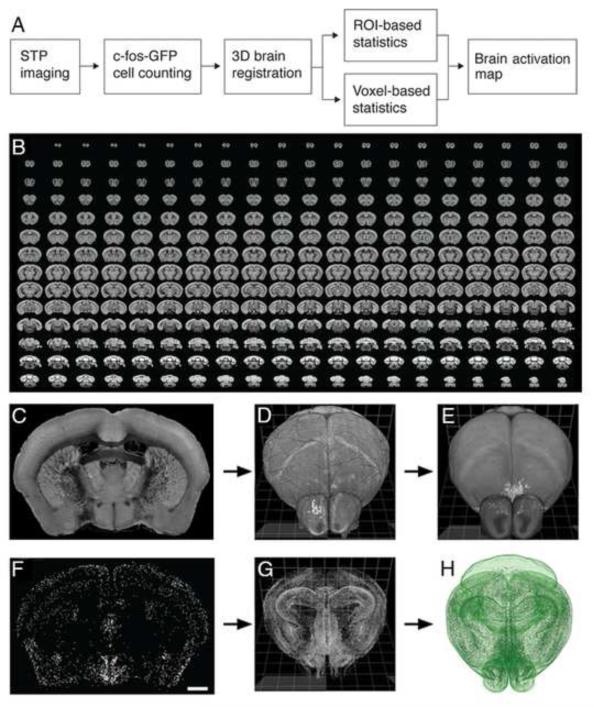
Figure 1. STP tomography and computational detection of c-fos-GFP positive cells.
(A) Imaging and data processing pipeline for mapping whole-brain activation in c-fos-GFP mice. (B) A sample 280-serial section dataset of a c-fos-GFP mouse brain imaged by STP tomography. (C-H) Registration of CN-detected c-fos-GFP+ cells in the RSTP brain. (C) A coronal section shows the autofluorescence signal, which is used for registering the 3D reconstructed sample brain (D) onto the RSTP brain (E). (F) 2,177 c-fos-GFP+ cells were detected in the same coronal section; scale bar = 1 mm. (G) 360,183 c-fos-GFP+ cells were detected in the whole brain, reconstructed in 3D and (H) registered onto the RSTP brain using the image registration parameters established in the (D-E) step.

