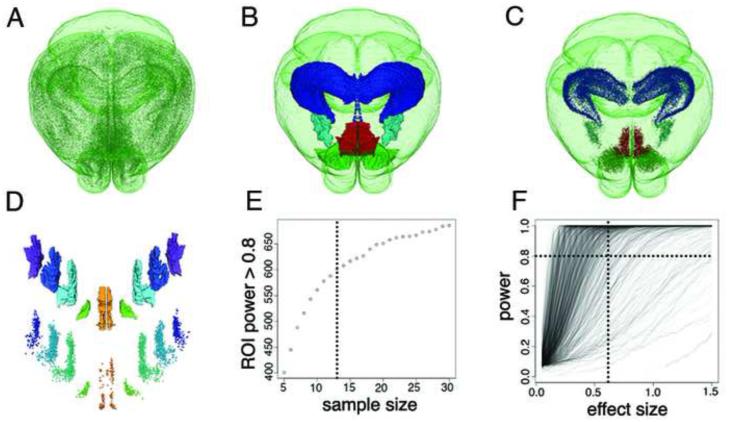
Figure 2. ROI-based segmentation and sample size calculation.
(A-D) ROI-based segmentation of the whole-brain c-fos-GFP+ cell count. (A) Whole-brain view of 360,183 c-fos-GFP+ cells (same brain as in Figure 1H). (B) Examples of ABA ROI segmentation and (C) the corresponding c-fos-GFP+ cell counts: hippocampus—dark blue; 33,508 cells; medial amygdalar nucleus—light blue; 3,035 cells; nucleus accumbens—green; 13,627 cells; and infralimbic cortical area—red; 4,665 cells. (D) Further segmentation of the infralimbic region by cortical layers: top shows the layer ROIs, from layer 1 (orange) to layer 6 (purple); bottom shows the c-fos-GFP+ cell counts: ILA1 = 223, ILA2 = 243, ILA2/3 = 1,572, ILA5 = 1,731, ILA6 = 896 c-fos-GFP+ cells. The spacing between the layers was enlarged for better visualization. (E-F) Estimation of the sample size based on power analysis of c-fos-GFP+ cell counts. (E) The simulation of the relationship between the number of sufficiently powered ROIs and the sample size shows a steep increase till about N = 10, which then begins to plateau. For the current study we chose a sample size of N = 13 (dashed line). (F) The plot of the relationship between the statistical power of each ROI and the effect size for N = 13 group. Of the total 763 ROIs analyzed, 601 (78.8%) showed sufficient statistical power at the effect size 0.6 and 699 (91.6%) at the effect size 1.0.

