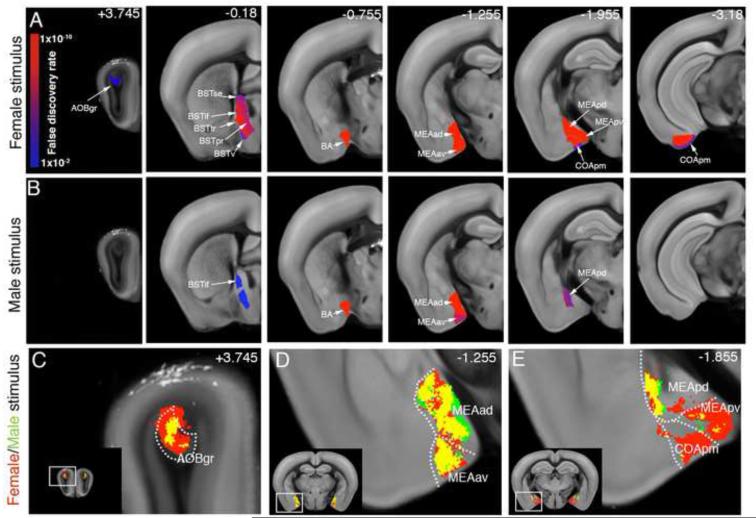
Figure 4. Social behavior-activated areas: the AOB and its direct downstream circuitry.
(A-B) ROI analysis: The male-female (A) and male-male groups (B) are compared to the handling group and significantly activated ROIs downstream of the AOB are displayed. The female stimulus activated all AOB downstream regions, while the male stimulus induced only a partial activation of these areas. Heatmap in (A) represents FDR corrected statistical significance. Numbers in (B) represent bregma A/P coordinates. See Table S2 for ROI full names. (C-E) Voxel based analysis revealed a largely overlapping activation pattern (yellow) in the co-activated AOB (C), MEAad and MEAav (D), and MEApd (E), and selective female-evoked activation in the MEApv and COApm (E). See also Movie S3 for full dataset.

