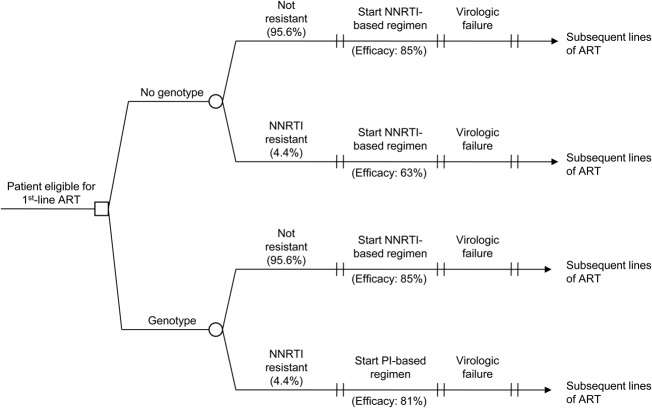
FIGURE 1.
Decision tree diagram for a model of HIV genotype testing. Results of each of the 4 arms (No Resistance, No Genotype; No Resistance, Genotype; Resistance, No Genotype; Resistance, Genotype) are weighted based on the prevalence of NNRTI resistance in Brazil. Initial ART regimen and efficacy vary by arm. Subsequent-line ART regimens are identical for each arm.

