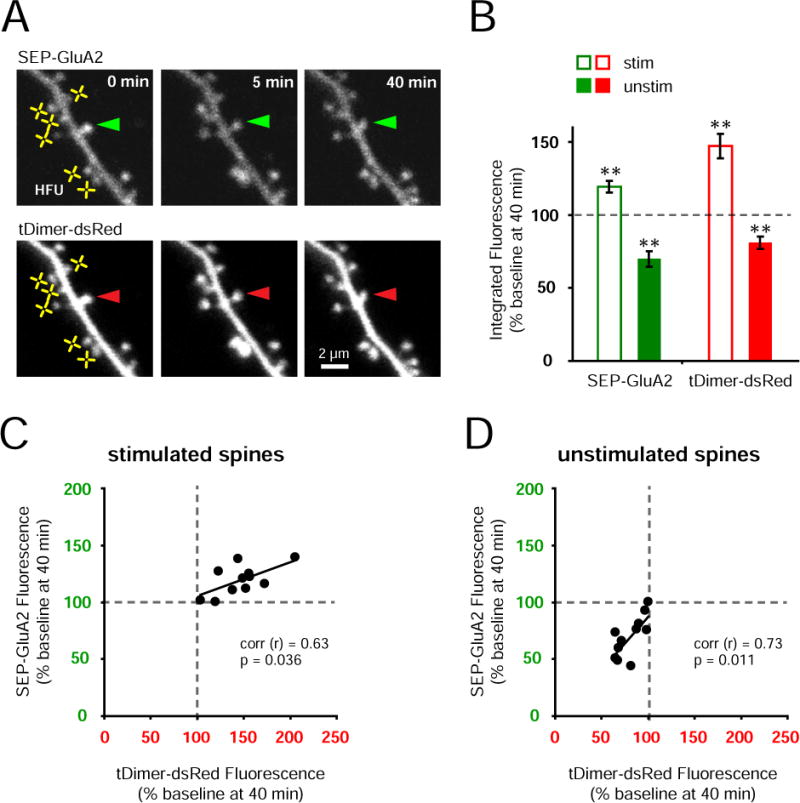
Figure 2. Heterosynaptic spine shrinkage is tightly coupled to synaptic weakening.

(A) Images of a dendrite from a CA1 neuron cotransfected with SEP-GluA2 and tDimer-dsRed. Fluorescence of SEP-GluA2 (top row) and tDimer-dsRed (bottom row) decreased in an unstimulated spine (arrowheads) following HFU-stimulation (yellow crosses) of multiple neighboring spines.
(B) SEP-GluA2 fluorescence increased (open green bar; 11 cells, average 6 spines per cell; p < 0.01) along with spine size (open red bar; p < 0.01) in HFU-stimulated spines; SEP-GluA2 fluorescence decreased (solid green bar; 11 spines; p < 0.01) along with spine size (solid red bar; p < 0.01) in nearby unstimulated spines.
(C) Increases in tDimer-dsRed and SEP-GluA2 fluorescence intensity were tightly correlated in stimulated spines (r = 0.63; p < 0.05) in response to HFU.
(D) Decreases in tDimer-dsRed and SEP-GluA2 fluorescence intensity were tightly correlated in unstimulated spines (r = 0.73; p < 0.05) following potentiation of multiple neighboring spines.
