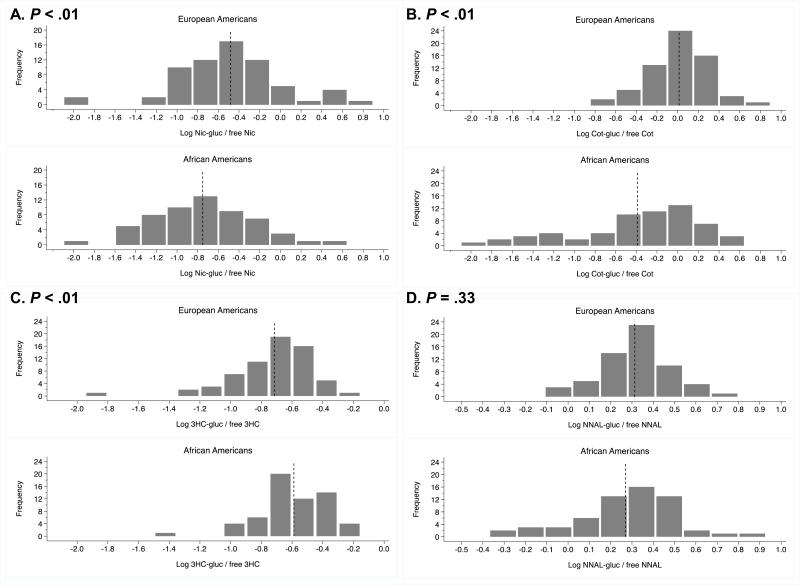
Figure 2.
Glucuronidation phenotypes among European Americans and African Americans expressed as the logarithm transformed ratio of glucuronide conjugate over free nicotine in A, cotinine in B, trans-3-hydroxycotinine in C, and NNAL in D. Dotted lines indicate mean values of logarithm transformed phenotypes (refer to Table 1 for non-transformed means). P values, A-D, from nonparametric Wilcoxon ranksum test comparing the phenotype distribution by ethnicity.

