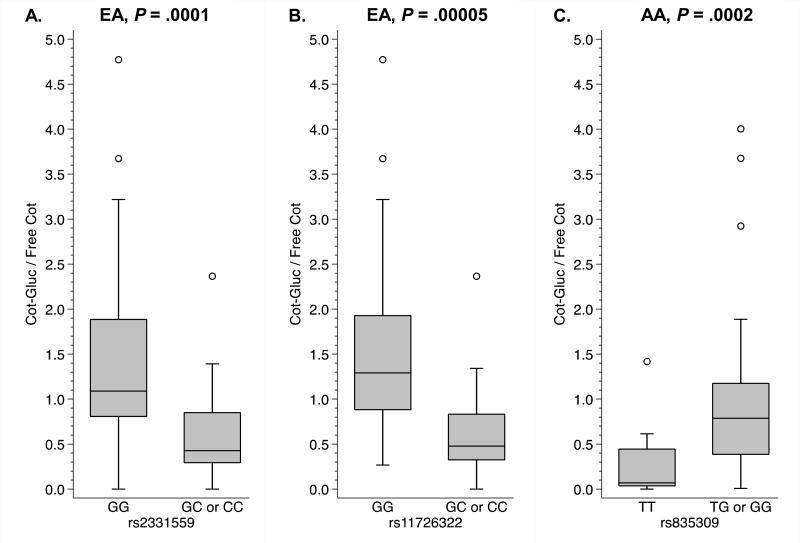
Figure 3.
UGT2B10 variants significantly associated with cotinine glucuronidation following correction for multiple testing. Individuals heterozygous or homozygous for the minor alleles of rs2331559 in A and rs11726322 in B had lower cotinine glucuronide ratios, whereas individuals heterozygous or homozygous for the minor allele of rs835309 in C had higher cotinine glucuronide ratios. Genotype-phenotype relationships illustrated with box plots displaying the median value and interquartile range (25th to the 75th percentile) and whiskers displaying the upper and lower values within 1.5 times the interquartile range, and open circles displaying outlying individuals. P values from multivariate logistic regression modeling assuming a dominant effect of the minor allele. EA: European American; AA: African American.

