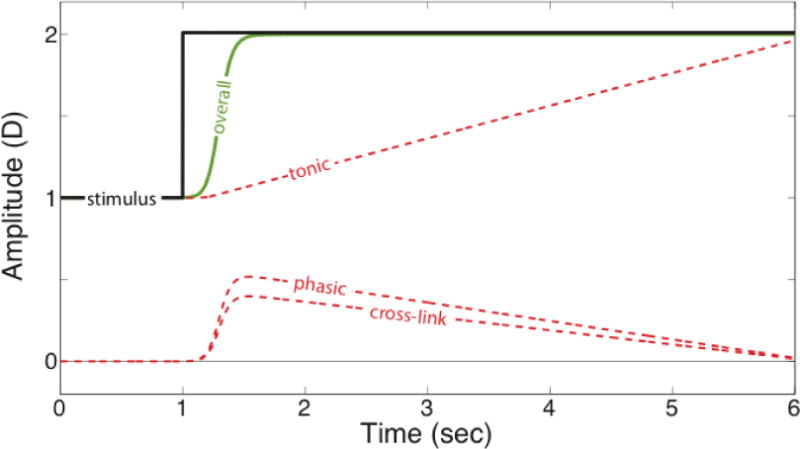
Figure 1.

Vergence response to a step stimulus in natural viewing according to the model of Schor (1992). Response in diopters is plotted as a function of time. The black line represents the stimulus, which is at a distance of 1D initially and then steps to a distance of 2D. The dashed red lines represent the responses of the tonic, phasic, and cross-link components. The green solid line represents the vergence response itself, which is the sum of the three component responses. The initial response is mostly supplied by the phasic and cross-link responses. The tonic response increases slowly, but eventually maintains vergence at the appropriate value. Accommodative responses, which are not shown here, would be very similar.
