
Figure 4.
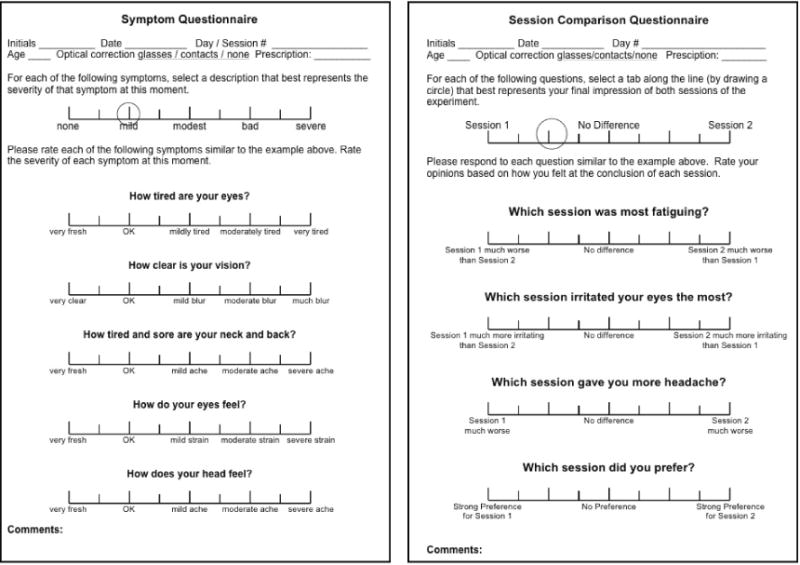
Questionnaires for measuring discomfort. Left: The symptom questionnaire. Subjects answered these five questions after each session. Scores of 1 to 9 were assigned to the tick marks on the scale. Right: The session-comparison questionnaire. Subjects answered these four questions after every two sessions at a given temporal frequency. Scores of 1 to 9 were again assigned to the tick marks.