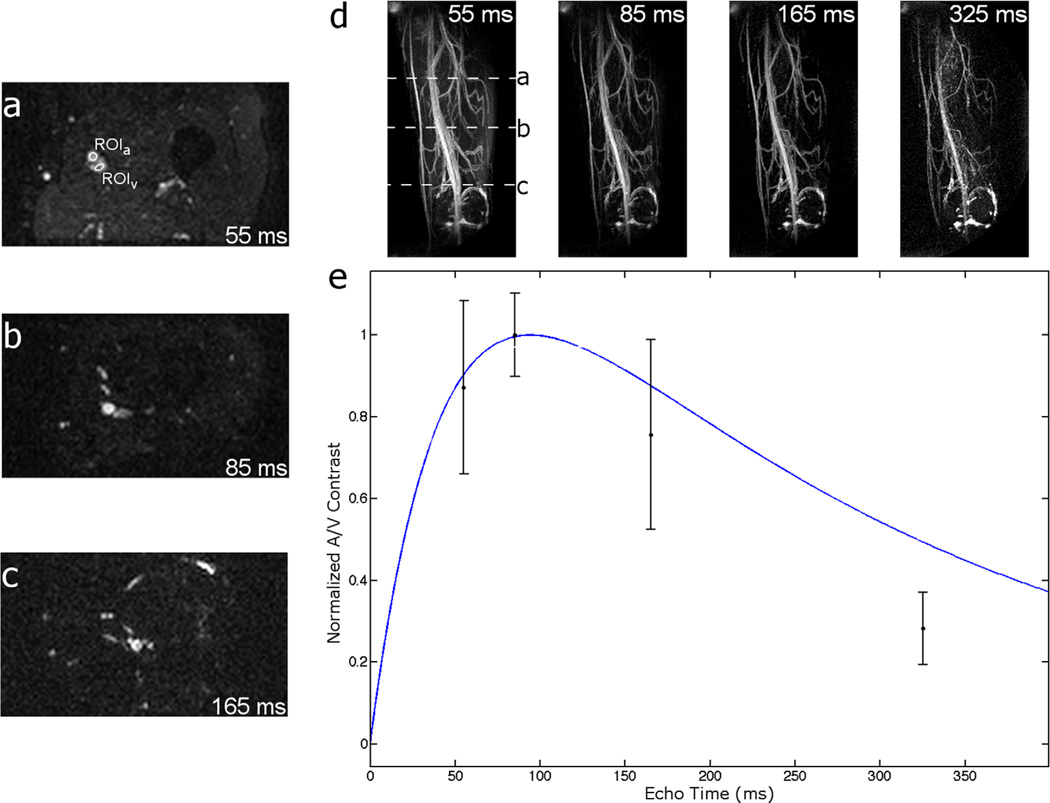
FIG. 4.
Spiral TSE noncontrast angiograms. a–c: Axial cross-sections of volumetric image data at TE = 55, 85, and 165 ms, respectively. Each axial slice’s position is indicated in the 55 ms MIP image of (d). d: MIP images of a normal volunteer’s thigh at various TEs. e: Plot of measured and predicted artery–vein contrast. Artery–vein contrast is maximized at TE just over 100 ms and follows the general shape predicted by Bloch equation simulations (see Fig. 3) of artery–vein contrast evolution (blue line). Muscle signal is suppressed with any choice of TE > 80 ms. [Color figure can be viewed in the online issue, which is available at wileyonlinelibrary.com.]

