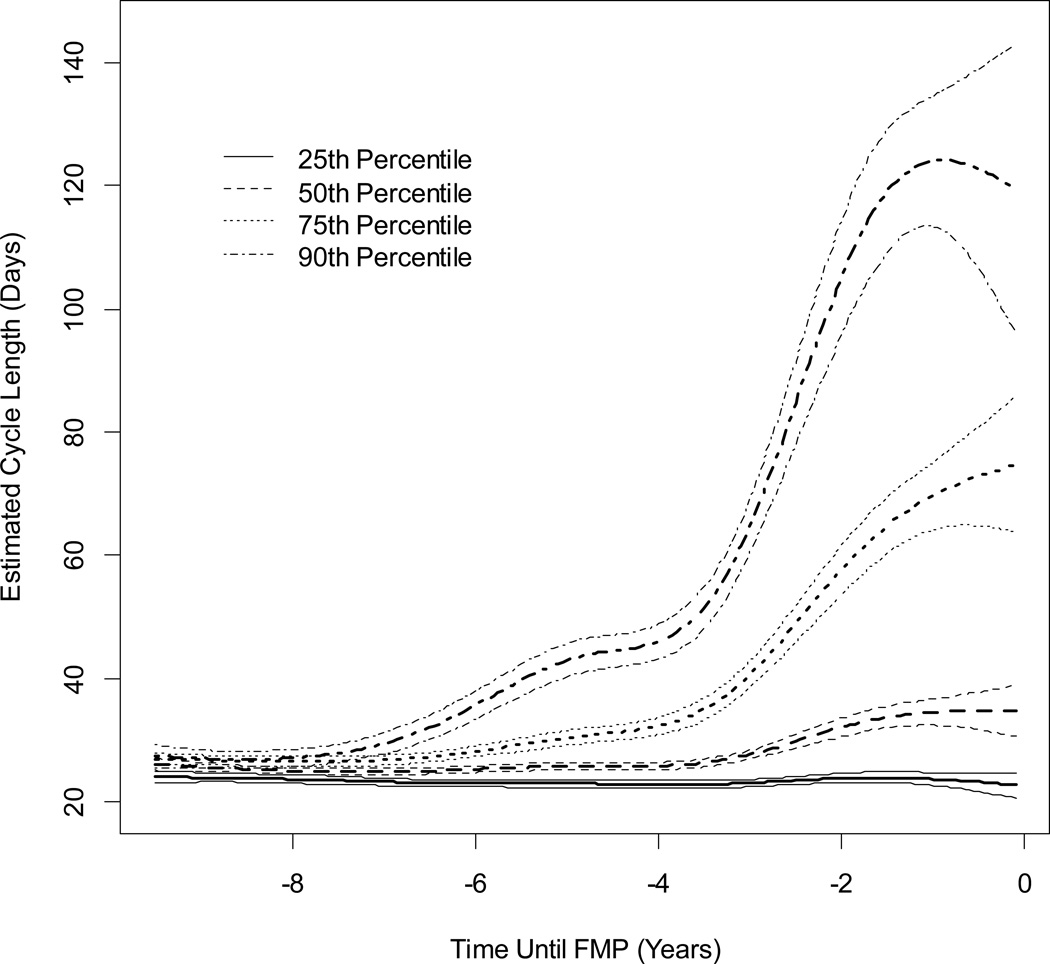
Figure 2.
Estimated Cycle Length 95% Confidence Intervals by Time Until FMP From Multivariable Quantile Regressions for Four Percentiles: 25th, 50th, 75th and 90th.
Natural cubic spline of time until FMP contained 5 knots at -5, -4,-3,-2, and -1 years. FMP is at time 0. Estimated cycle lengths are for women who were White, normal or underweight, did not smoke, had at least some post high school education, and did not have any moderate or physical activity during the average week. Sample size decreases as time moves farther from the FMP.

