Figure 6.
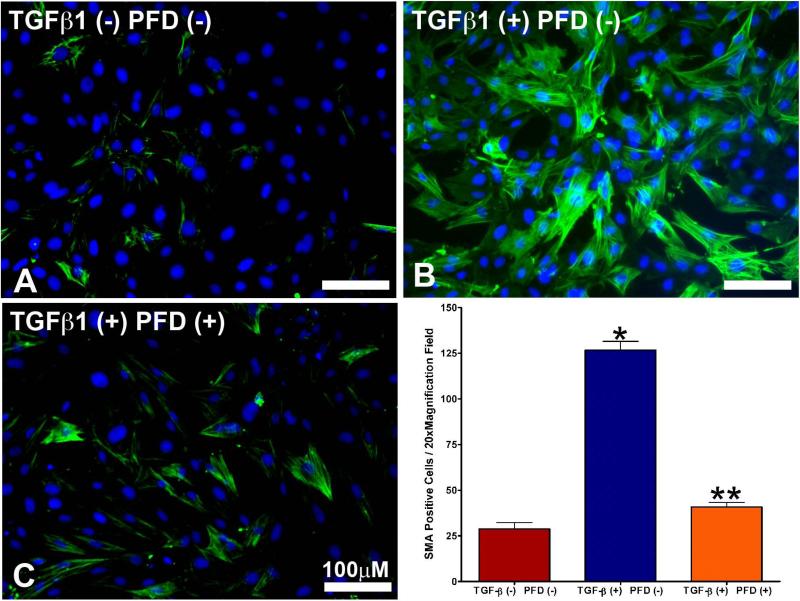
a. Immunocytochemical staining using the myofibroblast marker αSMA antibody (green) in untreated control ECFs.
Figure 6b. TGFβ1 treatment (1ng/ml) showed increased myofibroblast formation compared to untreated control ECFs.
Figure 6c. The 200 μg/ml PFD treatment showed significant reduction in TGFβ1-induced myofibroblast formation. Nuclei are stained blue with DAPI. Scale bar denotes 100 μm.
Figure 6d. Immunocytochemical staining quantification of αSMA. TGFβ1 treatment of ECFs produced a significantly higher level of αSMA staining when compared to the untreated control group. Treatment with 200 μg/ml PFD significantly decreased TGFβ1-induced myofibroblast formation. Error bars indicate standard error.
* denotes P < 0.001 (untreated control versus TGFβ1 treatment)
** denotes P < 0.001 (TGFβ1 treatment versus TGFβ1 + PFD treatment).

