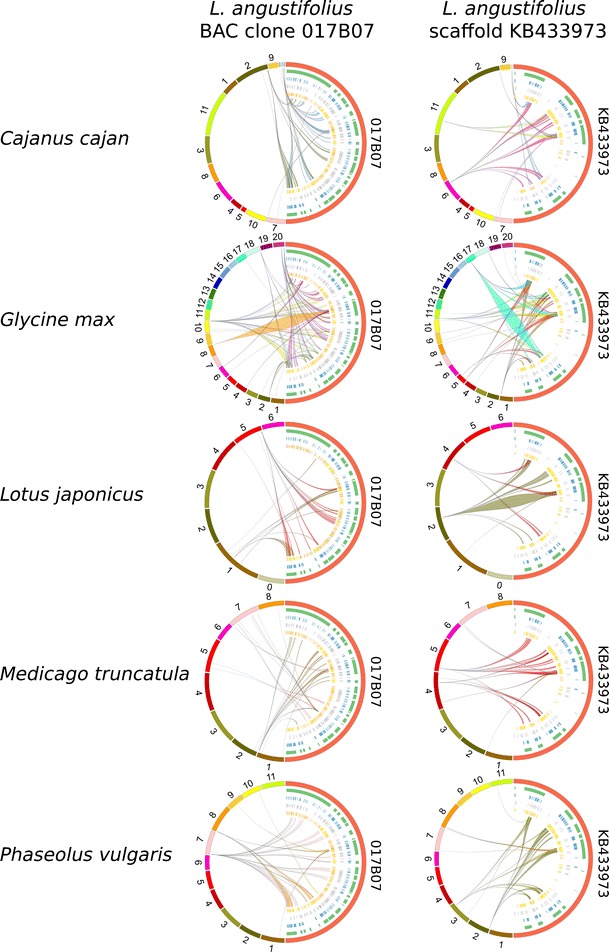
Fig. 4.

General insight into gene-rich region (GRR) microsynteny between L. angustifolius and five model legume species. Two narrow-leafed lupin GRRs are shown: BAC clone 017B07 and scaffold KB433973. Repetitive sequences were masked prior to analysis. Circos (Krzywinski et al. 2009) plots are ordered in rows according to the species (Cajanus cajan, Glycine max, Lotus japonicus, Medicago truncatula, and Phaseolus vulgaris). Reference legume chromosomes with appropriate numbers are drawn on the left of the external ring of each plot, while narrow-leafed lupin regions are shown on the right. The annotation data are presented on the internal rings as follows: genes (green); Fabaceae GenBank ESTs (blue); L. albus transcriptomic data (white); and L. luteus transcriptomic data (yellow). Ribbons symbolize homologous links identified by DNA sequence similarity. The chromosomes and corresponding lupin gene-rich regions are not drawn to scale
