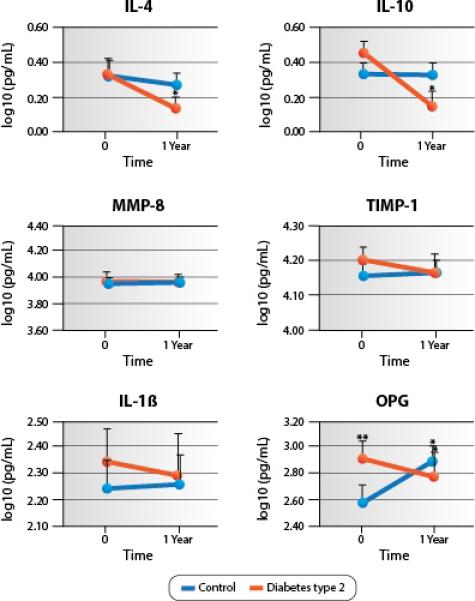
Figure 2.

Levels of selected salivary biomarkers over the study period. The levels of IL-4, IL-10, and OPG were significantly (*) reduced between baseline and follow-up visits in the diabetes group (p<0.05); on the other hand, the levels of OPG were significantly (*) increased from the baseline to the follow-up visit in the control group (p<0.05). The levels of OPG were significantly (**) different between groups at baseline (p<0.05).
