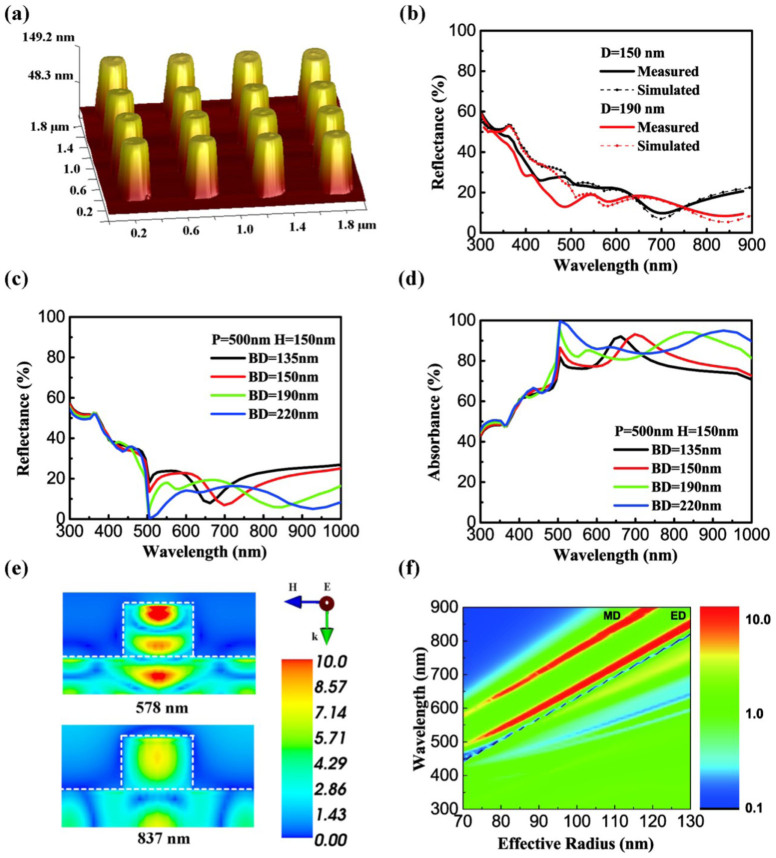
Figure 2. Mie resonance and absorbance spectra of the Si nanopillar arrays.
(a) AFM image of the nanopillar sample with BD = 190 nm, H = 150 nm, P = 500 nm. (b) Average value of transverse electric (TE) and transverse magnetic (TM) modes from the simulations is compared with experiment; the incident angle is 8 degree. (c,d) Simulated reflectance and absorbance spectra of silicon nanopillar arrays with different diameters. (e) Electric field distributions (|E|/|E0|) of Si nanopillar arrays in (b), the diameter is 190 nm. (f) Qsca of the Si nanopillar with different effective radius. Mie resonance peaks redshift with the effective radius of nanopillar.

