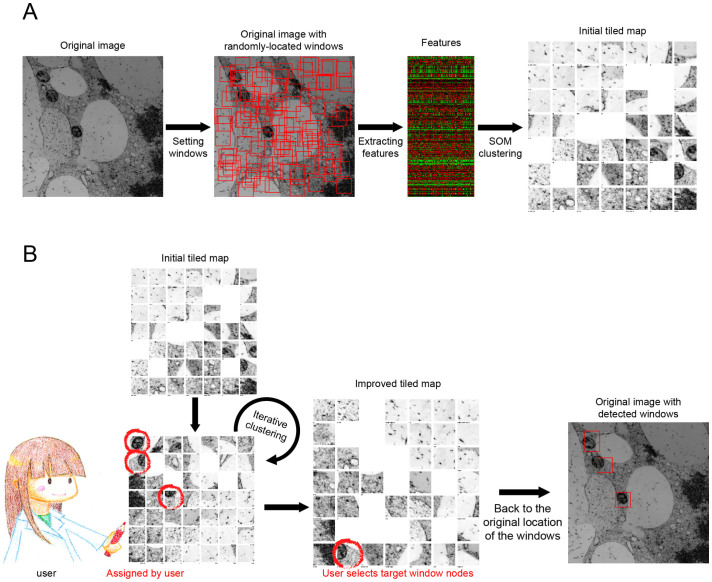
Figure 1. Workflow of semi-automatic detection of organelles in TEM images.
(A) Scheme of setting randomly located windows and summarizing window distribution based on features. To summarize data from window images in the CARTA framework, a self-organizing map, designated as the initial tiled map, was used4. A part of a tobacco cultured cell TEM image (see also Figure 2) was shown as an example. (B) User interaction to improve the tiled map and detect target organelles. The tiled map can be improved to assemble target organelle windows by repeated manual assignment (handwritten red circles) during iterative clustering. After this improvement, organelles can be semi-automatically detected via the user's selection of representative target window nodes in the map (red rectangles). Stars in the tiled map indicate number of hidden windows at each node (See also Supplementary Fig. S1.).

