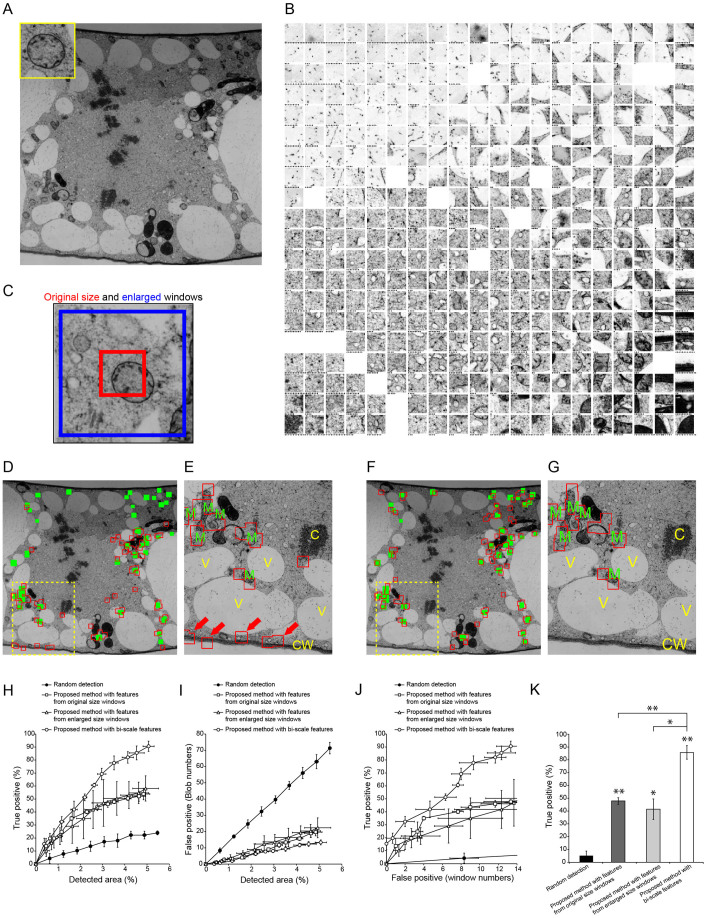
Figure 2. Semi-automatic detection of mitochondria in a tobacco cultured cell TEM image.
(A) TEM image used to detect mitochondria (inset). Image resolution: 2000 × 2000 pixels. (B) Tiled map of 2000 windows, which were randomly located in the TEM image shown in (A). Stars indicate number of hidden windows at each node. (C) Example of original size window (red) and enlarged window (blue). (D) Results of semi-automatic detection based on features from original size windows. Green rectangles show ‘true' mitochondria, which were confirmed by visual inspection; red boxed regions show semi-automatically detected windows. (E) Magnified image of yellow dashed box in (D). M, mitochondrion; C, chromosome; V, vacuole; CW, cell wall. Red arrows show false positive (misdetected) windows. (F) Results of semi-automatic detection based on features from original size and enlarged windows (bi-scale features) as shown in (C). Green rectangles show ‘true' mitochondria; red boxed regions show semi-automatically detected windows that were drawn with original size windows. (G) Magnification of yellow dashed box in (F). M, mitochondrion; C, chromosome; V, vacuole; CW, cell wall. Note the lower rate of misdetection compared with that in (E). (H, I) Relationship between detection area and true (H) or false (I) positive rates of detection with random selection of randomly located windows (filled circles) and with proposed methods with features from original size windows (open squares), enlarged windows (open triangles), and both of them (bi-scale features; open circles). Data are mean ± SD from three independent experiments. (J) Relationship between true and false positive detection rates random selection of randomly located windows (filled circles) and proposed methods based on features from original size windows (open squares), enlarged windows (open triangles), and both of them (bi-scale features; open circles). Data are mean ± SD from three independent experiments. (K) Comparison of true positive detection rates. Mean number of false positive windows was 10.3 (random selection) (N = 4), 12.8 (with features from original size window) (N = 9), 11.3 (with features from enlarged windows) (N = 6) and 12.3 (with bi-scale features) (N = 10). Data are mean ± SD. Significance was determined using Mann–Whitney's U-test (p-value, *<0.0003. **<0.0001).

