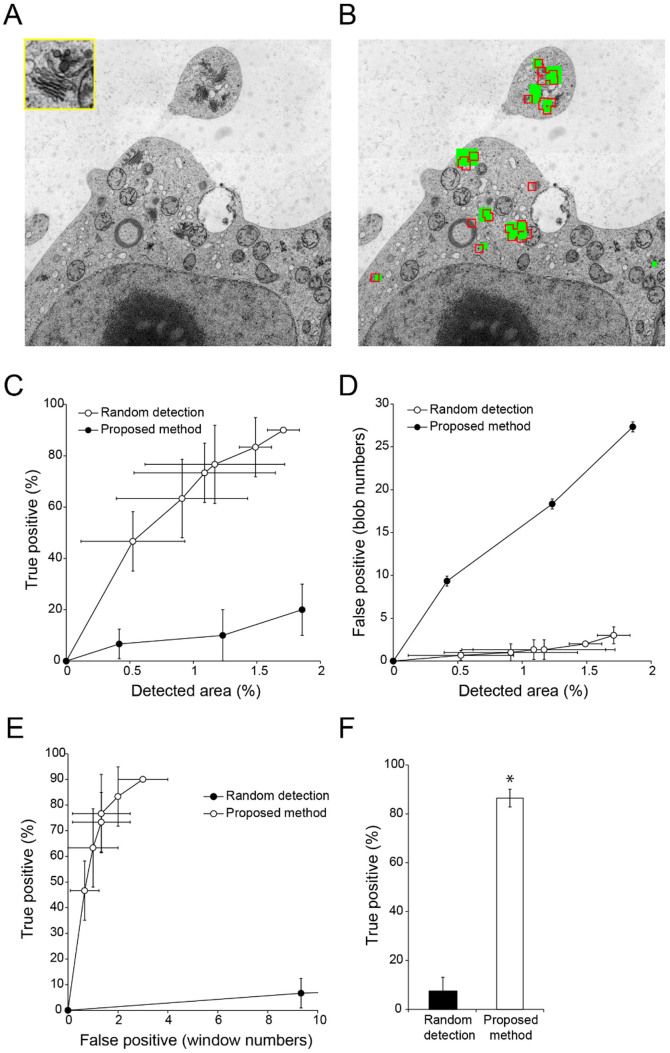
Figure 6. Semi-automatic detection of Golgi stacks and vesicle cluster-shaped compartments (trans-Golgi network and/or secretory vesicle cluster) in a TEM image of tobacco cultured cells.
(A) TEM image used for detection of Golgi stacks and vesicle cluster-shaped compartments2,6 (inset). Image resolution: 2000 × 2000 pixels. (B) Results of semi-automatic detection. Green rectangles show ‘true' Golgi stacks and vesicle cluster-shaped compartments, which were confirmed by visual inspection; red boxed regions show semi-automatically detected windows. (C, D) Relationship between detection area and true (C) or false (D) positive detection rates with random selection of randomly-located windows (filled circles) and proposed methods (open circles). Data are mean ± SD from three independent experiments. (E) Relationship between true and false positive detection rates with random selection of randomly-located windows (filled circles) and proposed methods (open circles). Data are mean ± SD from three independent experiments. (F) Comparison of true positive rates. Mean number of false positive windows was 11.5 (random detection) (N = 4) and 2.50 (proposed method) (N = 6). Data are mean ± SD. Significance was determined using Mann–Whitney's U-test (p-value, *<0.01).

