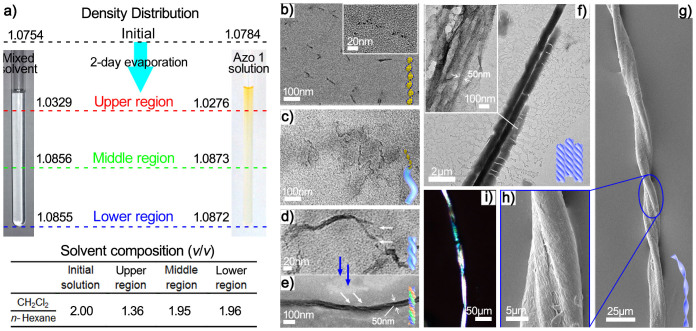
Figure 2. Morphologies of various aggregates that assembled in the gradient solution.
(a) The density distribution of the gradient solution and the corresponding composition of each region. (b, c, d, e, f) TEM images of the aggregates in various stages from oligomers to nanoribbons (b, c, d and e after a 2-day evaporation and (f), after approximately 5 days of evaporation). (g) UHRFE-SEM images of the final bundle after approximately 7 days of evaporation. (h) Local amplification of the bundle shown in Figure 3f. (i) An image of the wire bundle obtained using polarised optical microscopy (POM).

