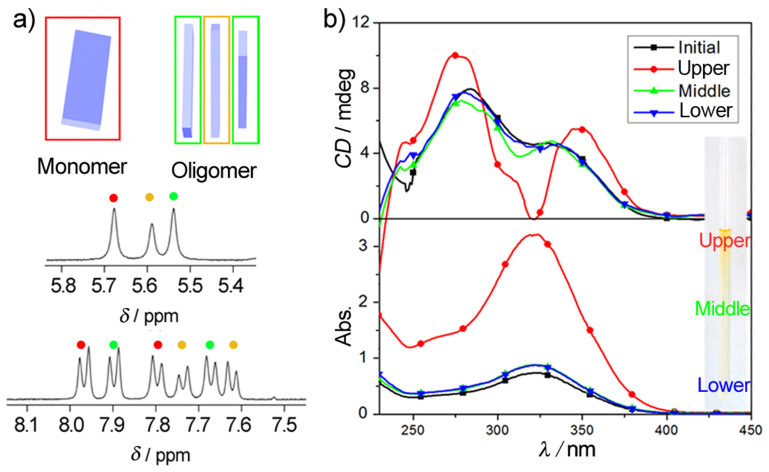
Figure 4. The assembly process and aggregate enrichment as measured based on NMR spectra.
(a) Stacked 1H NMR spectra and corresponding schematic representations of 2.5 mM Azo 1 dissolved in CDCl3. The blue block stands for the conjugated moiety of Azo 1. (b) CD and UV-Vis spectra of Azo 1 in the bulk solution before and after solvent evaporation for 2 days. (Here, C = 0.08 mM. For the upper region, the sample was diluted with equal amounts of solvent because CD signals exceeded the measurable range, and the solution was maintained at 25.0 ± 0.2°C.)

