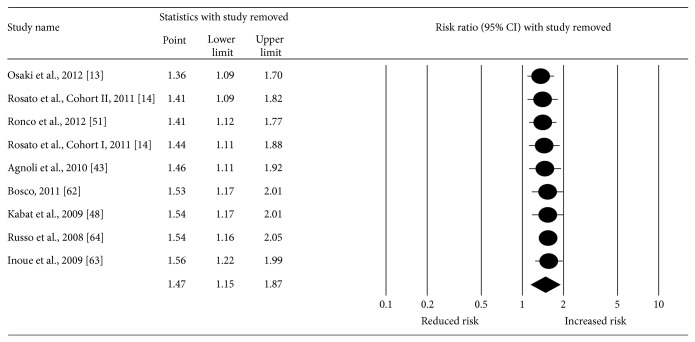
Figure 4.
Influence analysis with each result from each study deleted from the random-effects model once. The black circles represent the risk ratio (RR) for each result from each study while the horizontal lines represent the lower and upper 95% confidence interval (CI) for the RR. The black diamond represents the overall pooled result while the left and right sides of the diamond represent the lower and upper 95% CI for the pooled RR. For studies that included more than one definition of metabolic syndrome, the following were used: Agnoli et al. (tertile definition), Bosco (time-independent definition), Osaki et al. (modified NCEP 2001 definition), and Ronco et al. (diabetes, overweight, and hypertension definition).

