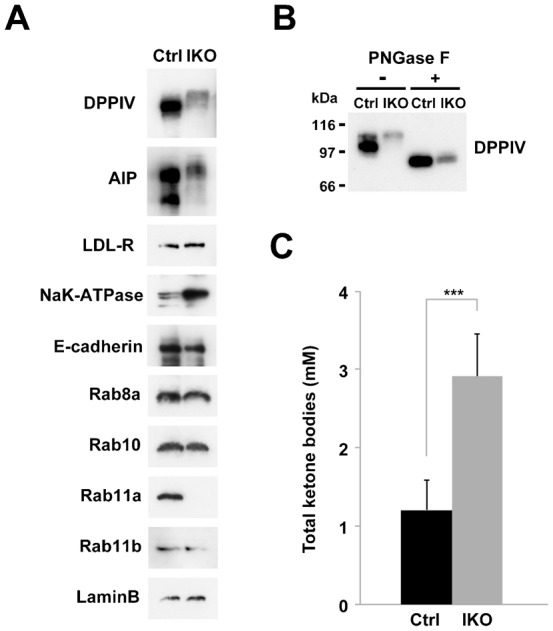
Fig. 5. Quantification of a starvation marker and protein levels.

(A) Western blot analysis of protein levels in crude extracts from the small intestines of control (Ctrl) and IKO mice at P5. Small intestine extracts were analysed by Western blot analysis using antibodies against various apical proteins (DPPIV and AlP), basolateral proteins (LDL-R, Na+K+ATPase, and E-cadherin), Rabs (Rab8a, 10, 11a, and 11b), and a loading control (Lamin B). (B) Treatment of peptide N-glycosidase F (PNGase F) in lysates from the small intestine of control (Ctrl) and IKO mice at P5. The samples were analysed by Western blotting using anti-DPPIV antibody. (C) Amounts of total ketone bodies in control (Ctrl) and IKO mice at P5. Values represent means ± s.d. from 4–10 mice. ***P<0.001; Student's t-test.
