Figure 4.

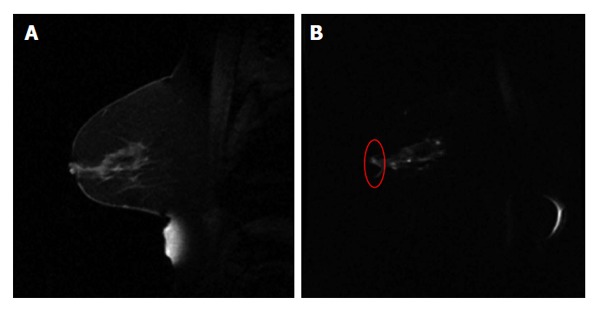
An example of sagittal breast T1w image (A) and the diffusion weighted image (b = 500 mm2/s) using echo planar imaging sequence (B). The red circle in (B) highlights the distorted breast boundary.

An example of sagittal breast T1w image (A) and the diffusion weighted image (b = 500 mm2/s) using echo planar imaging sequence (B). The red circle in (B) highlights the distorted breast boundary.