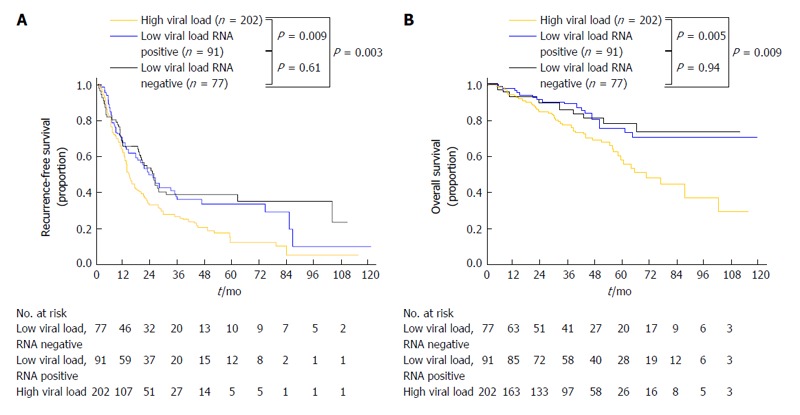
Figure 3.

Cumulative recurrence rate (A) and cumulative overall survival (B) curves of low and high viral load groups stratified according to the results of hepatitis C virus RNA quantification. (Adapted from Shindoh et al[60] with permission).

Cumulative recurrence rate (A) and cumulative overall survival (B) curves of low and high viral load groups stratified according to the results of hepatitis C virus RNA quantification. (Adapted from Shindoh et al[60] with permission).