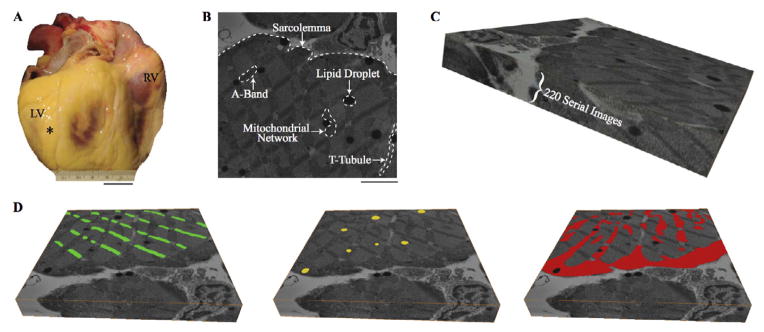
Figure 1.

Ultrastructure segmentation. A. Donated human heart with location of tissue sample marked by black asterisk. B. Example two-dimensional scanning electron microscopy image with ultrastructure highlighted. C. Serial section volume of 220 slices each 10 nm thick D. Example digital segmentation of A-bands (green), lipid droplets (yellow), and mitochondria (red) on first serial section. Scale Bars: 2 cm (A), 3 μm (B). Serial Section Volumes: 14.7 μm × 14.8 μm × 2.2 μm (C and D).
RV: right ventricle; LV: left ventricle; T-tubule: transverse tubule.
