
Figure 3.
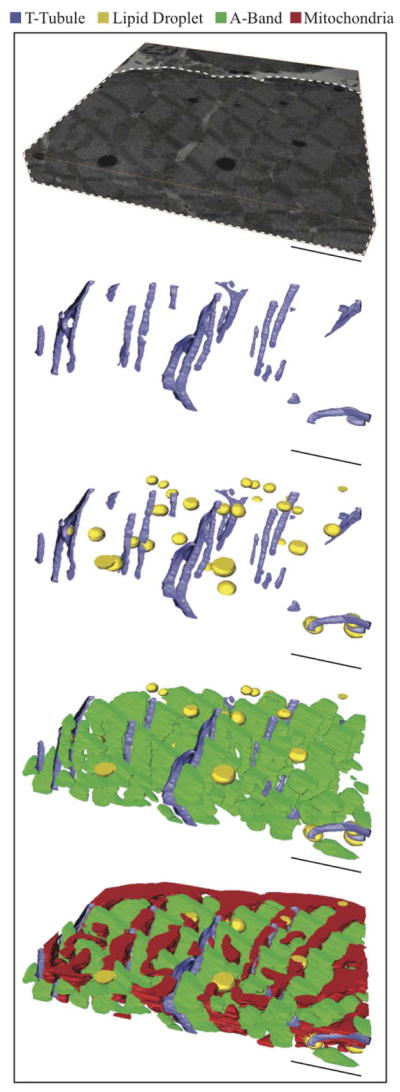
Sequential addition of ultrastructure. The serial section volume (Top) shows the orientation of the reconstructed ultrastructure volumes below, where the whited dotted line highlights the area of interest (myocyte). Scale Bars: 3 μm Serial Section. Volume: 14.7 μm × 14.8 μm × 2.2 μm (Top).