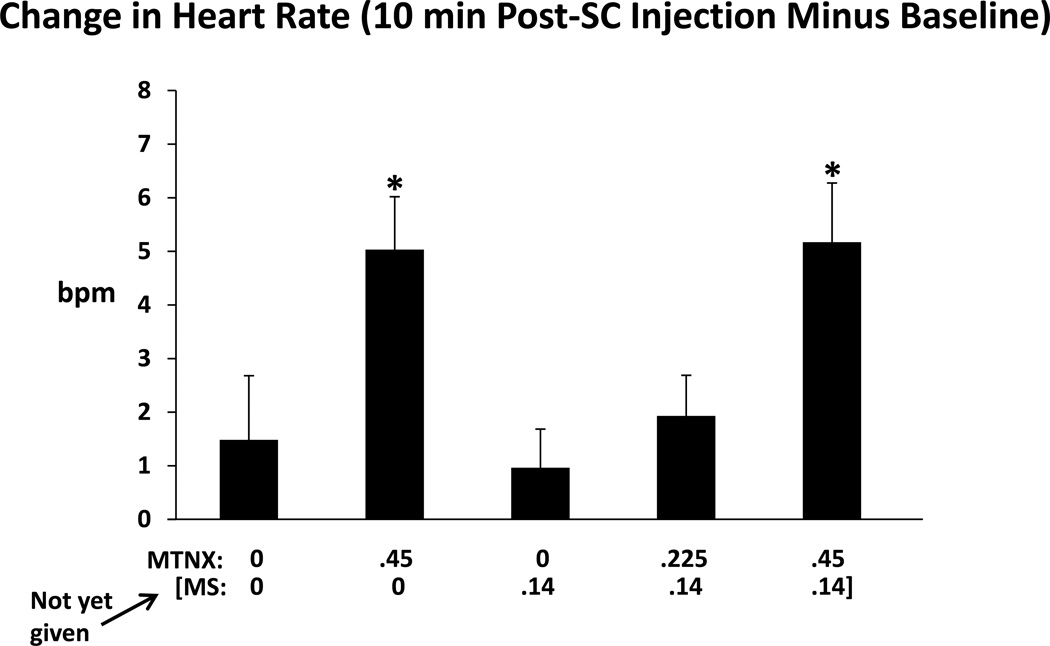
Figure 3.
Change in heart rate (bpm), determined by subtracting the baseline value from the value collected 10 min after the subcutaneous injection, for the five drug conditions. Brackets represent SE. Asterisks indicate a significant difference from the 0MTNX/.14MS condition (MS had not yet been administered).

