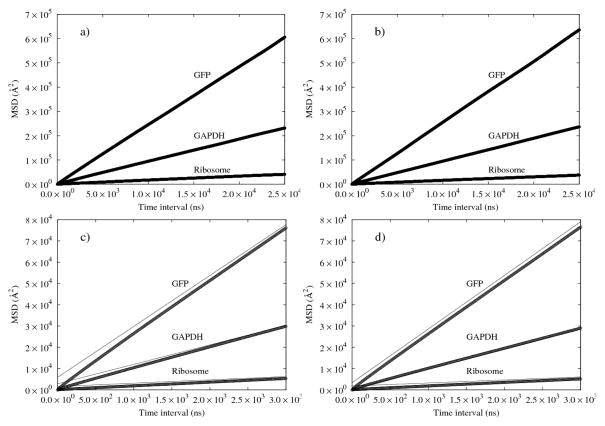
Figure 3.
MSDs of three macromolecules in sphere system (a, c) and molecular shaped-system (b, d) as a function of time interval, τ. MSDs up to 25 μs are shown in upper graphs (a, b). MSDs over the short-time range are shown in lower graphs (c, d). Solid lines in lower graphs are fitted lines in the time range from 10 to 25 μs. GAPDH represents glyceraldehyde-3-P dehydrogenase.

