Figure 1.

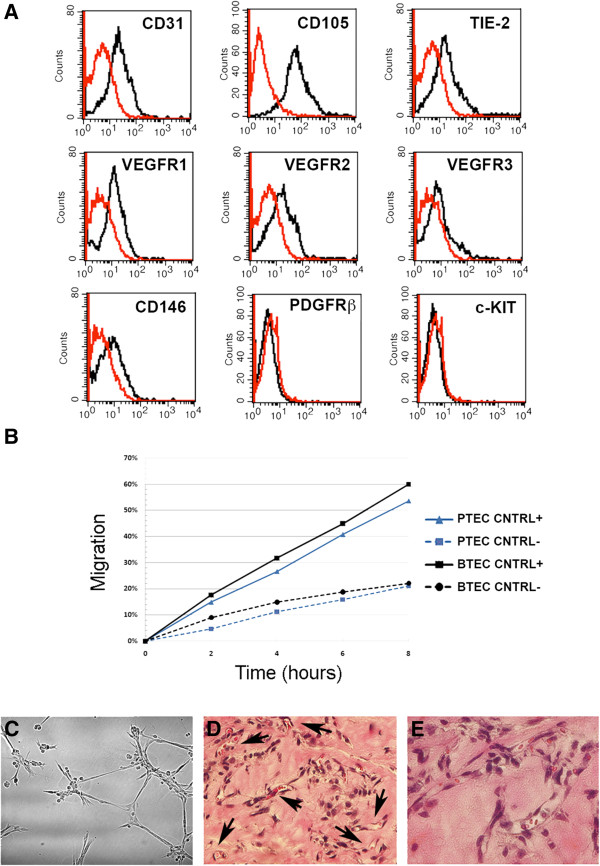
Characterization of PTEC lines. (A): Representative cytofluorimetric analysis of a PTEC line at the first passage. Specific antibodies are shown as black line, isotypic controls as red line. (B): Percentage of migration of PTEC (blue line) compared to endothelial tumor cells isolated from breast cancer (BTEC, black line) in EndoGRO plus 5% FCS (CNTRL+) or in DMEM without FCS (CNTRL-). (C-E): Representative images showing PTEC organization in vitro and in vivo. In vitro, PTEC plated on Matrigel-coated wells organized in capillary-like structures (18 h) (C). When injected in SCID mice within Matrigel, PTEC, organized in functional vessels containing red blood cells (arrows) (D and E, hematoxylin and eosin staining). Original magnification D: × 200, E: × 400. All the isolated lines showed a similar marker expression and functional properties in vitro and in vivo.
