
Figure 2.
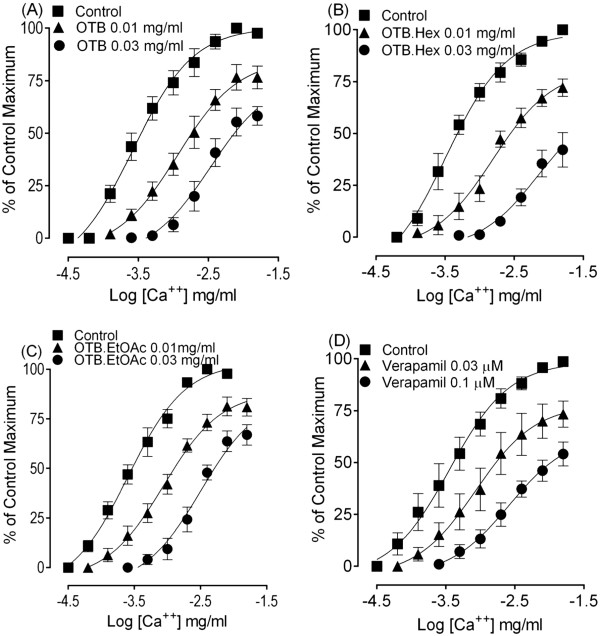
The concentration-response curves of Ca ++ in the absence and presence of the increasing concentrations of the crude extract of O. turpethum black variety (OTB) (A), hexane fraction (OTB.Hex) (B), ethyl acetate fraction (OTB.EtOAc) (C) and verapamil (D) constructed in Ca ++ -free and K + -rich (80 mM) Tyrode’s solution in isolated rabbit jejunum. The symbols represent mean ± S.E.M, n = 4.