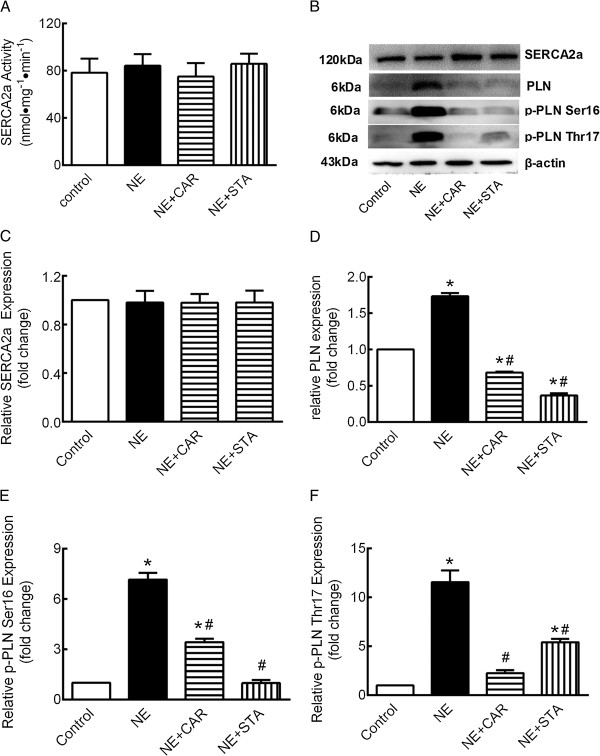
Figure 5.

Effects of STA on SERCA2a and PLN changes induced by NE. (A) Activity of SERCA2a, (B) Representative Western blot, (C) quantification of SERCA2a, (D) PLN, (E) Ser16 phosphorylation, and (F) Thr17 phosphorylation. These data were normalized to β-actin. The data are expressed as the mean ± SEM. n = 5. *P < 0.05 versus control, #P < 0.05 versus NE. NE: norepinephrine, CAR: carvedilol, STA: stachydrine, PLN: phospholamban.
