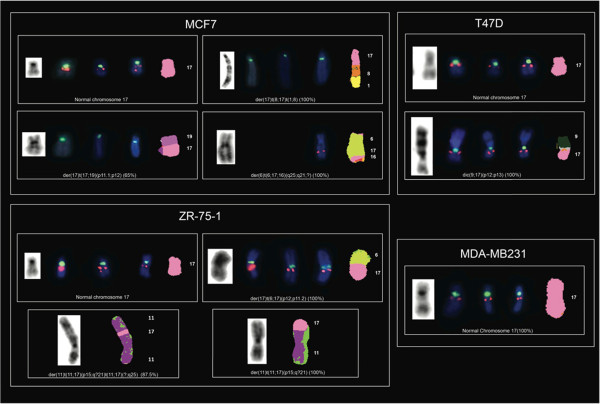
Figure 1.

Analysis of Chr17 using G-Banding, dual-color FISH ( HER2 /CEP17 , STARD3 /CEP17 and TOP2A /CEP17) and M-FISH in the MCF7, T47D, ZR-75-1 and MDA-MB231 not HER2 amplified breast cancer cell lines. Rearranged chromosomes containing a portion of Chr17 are visualized by G-Banding technique on the left and by M-FISH on the right. For M-FISH the classified color of Chr17 is shown in pink, the translocation partners are numbered on the right hand side of the chromosomes and the frequency at which each abnormality was observed is indicated in brackets at the end of each abnormality. CEP17, HER2, STARD3 and TOP2A are shown in the middle by dual-color FISH (HER2/CEP17, STARD3/CEP17, TOP2A/CEP17, respectively) whenever mapped to the corresponding derivatives (CEP17 is green-labeled; HER2, STARD3 and TOP2A genes are red-labeled).
