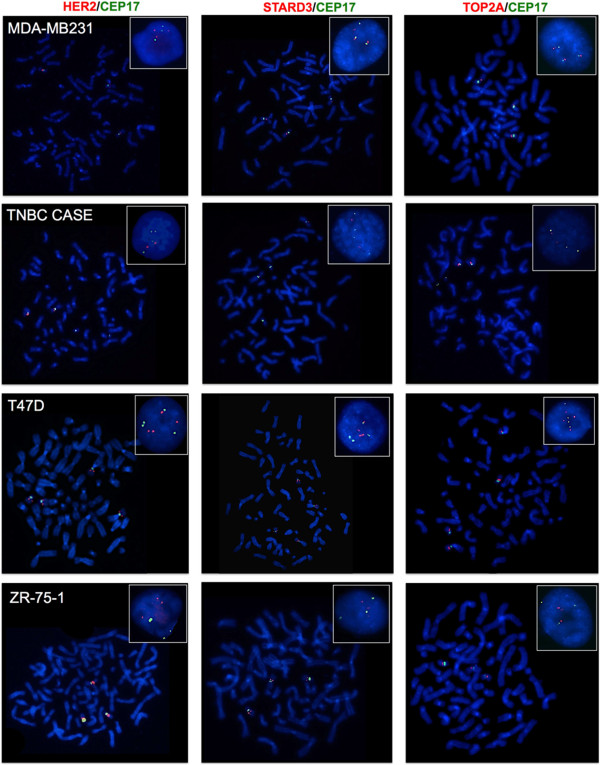
Figure 5.

Representative FISH images of the MDA-MB231, T47D and ZR-75-1 breast cancer cells and one TNBC case using HER2 /CEP17, STARD3 /CEP17 and TOP2A /CEP17 dual-color probes. Metaphase spreads are shown and boxes indicate representative interphase nuclei for each case. None of these cell lines showed amplification of the HER2, STARD3 or TOP2A genes. Gene signals are red-labeled, CEP17 signals are green-labeled.
