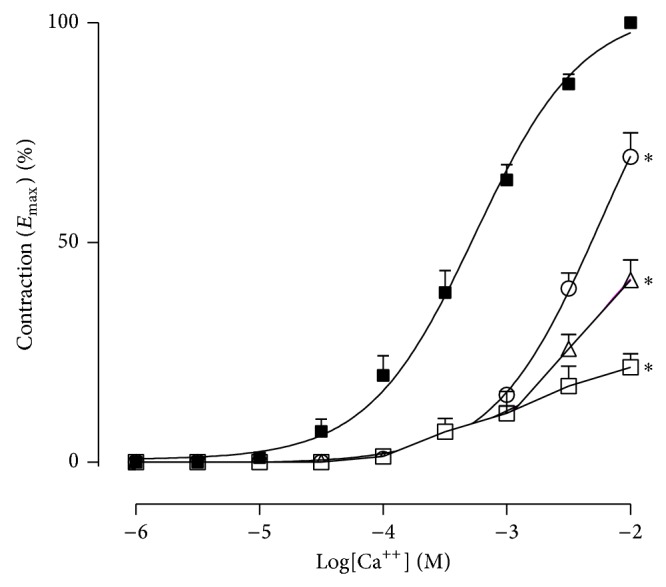
Figure 5.

Cumulative dose-response curves to CaCl2 in isolated endothelium-deprived and depolarized mesenteric arteries from spontaneously hypertensive rats. Control (■), HESC 0.1 mg/mL (о), HESC 0.25 mg/mL (Δ), and HESC 0.5 mg/mL (□). Values are the mean ± SEM (n = 6-7). * P < 0.05 versus control.
