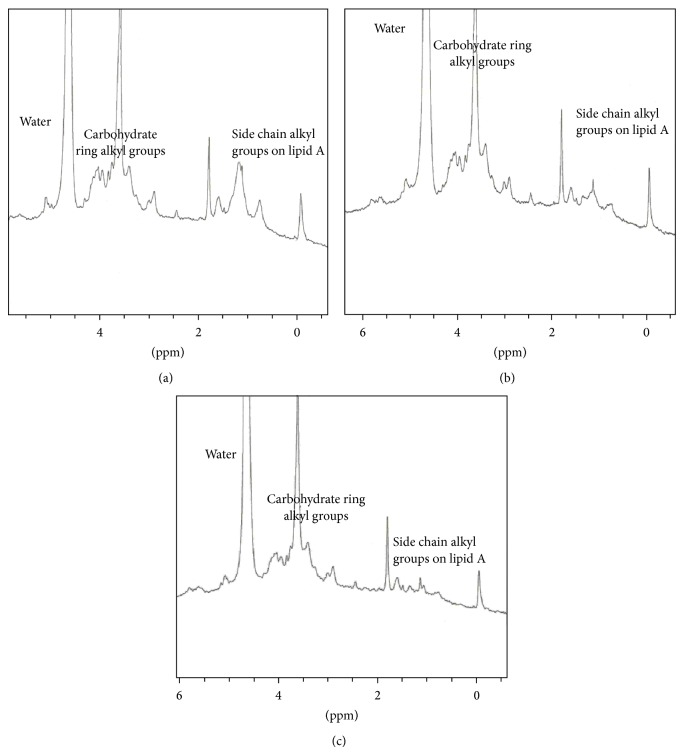
Figure 5.
1H NMR spectra of (a) LPS isolated from K. pneumoniae; (b) AMP 70 in the presence of LPS isolated from K. pneumoniae; (c) AMP 79 in the presence of LPS isolated from K. pneumoniae. The chemical shift region from 6.0 to 0.0 ppm is shown. Addition of the AMP results in a reduction in peak intensities in the region 2.0 to 0.7 ppm. This region corresponds to the protons on the alkyl side chains of lipid A.

