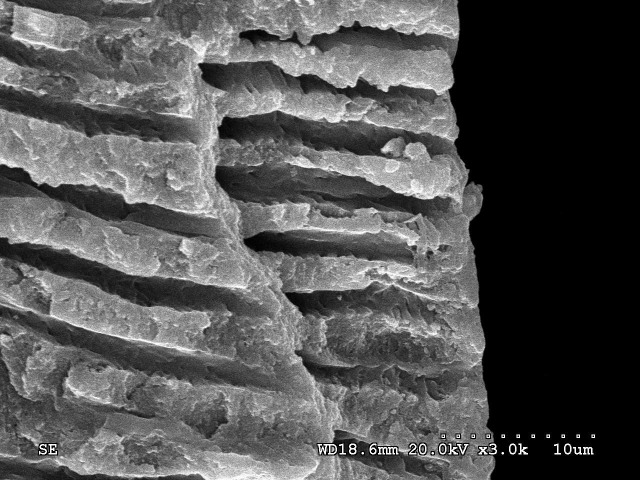
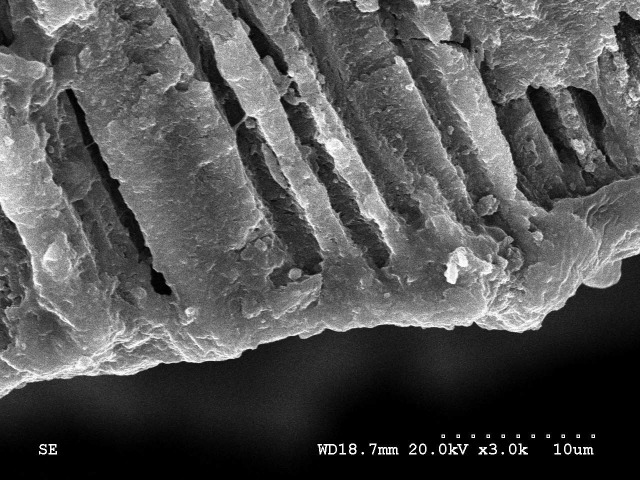
Figure 7.
SEM micrograph of longitudinal section parallel to the direction of the dentinal tubules’ alignment. (a) SEM micrograph of control group; the dentinal tubules were open (×3000). (b) SEM micrograph of dentin after 2.0 W/CW (166 J/cm2) of 980-nm diode laser treatment. The sealing depth of the melted dentin reached 8 mm (×3000).


