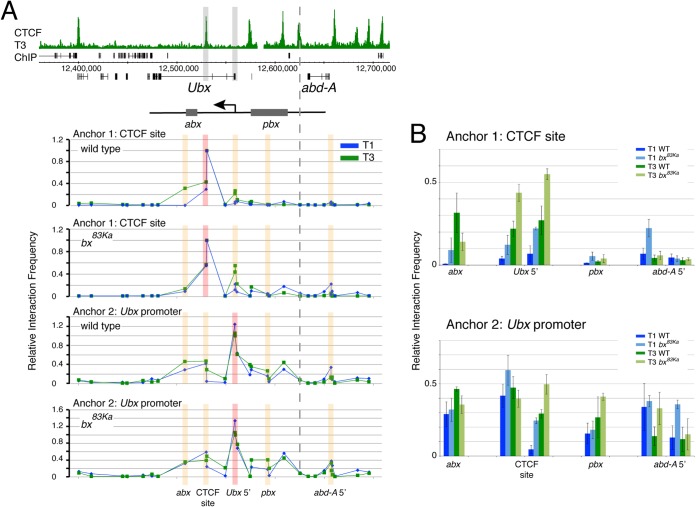
FIG 5.
Chromatin interactions in the BX-C in T1 and T3, comparing data for the wild type and the bx83Ka mutant. (A) 3C interactions at 29 sites in the BX-C. Top, overview of the BX-C showing the T3 CTCF ChIP profile with 3C anchor positions highlighted in gray. The positions of the abx and pbx regulatory regions are indicated, corresponding to abx1 deletion (27) and pbx deletions (61). The graphs below show the 3C profiles. The genomic sites of anchors 1 (primer 590) and 2 (primer 675) are indicated. Anchor positions are indicated by red bars, and orange bars indicate positions whose results are detailed in panel B. The dotted line indicates the boundary between the Ubx and abd-A regulatory domains (61). Primers are listed in Tables 2 and 3. (B) Comparisons of interactions at specific sites focusing on selected primers that are closest to key genomic features; for the interactions between anchors and the abx region, we show data for primer 8; for the variable CTCF site, primers 9 (left bars) and 10 (right bars); for the Ubx promoter, primers 12 (left bars) and 13 (right bars); for the pbx region, primer 17; and for the abd-A promoter, primers 24 (left bars) and 25 (right bars). Error bars show standard errors of the means.

