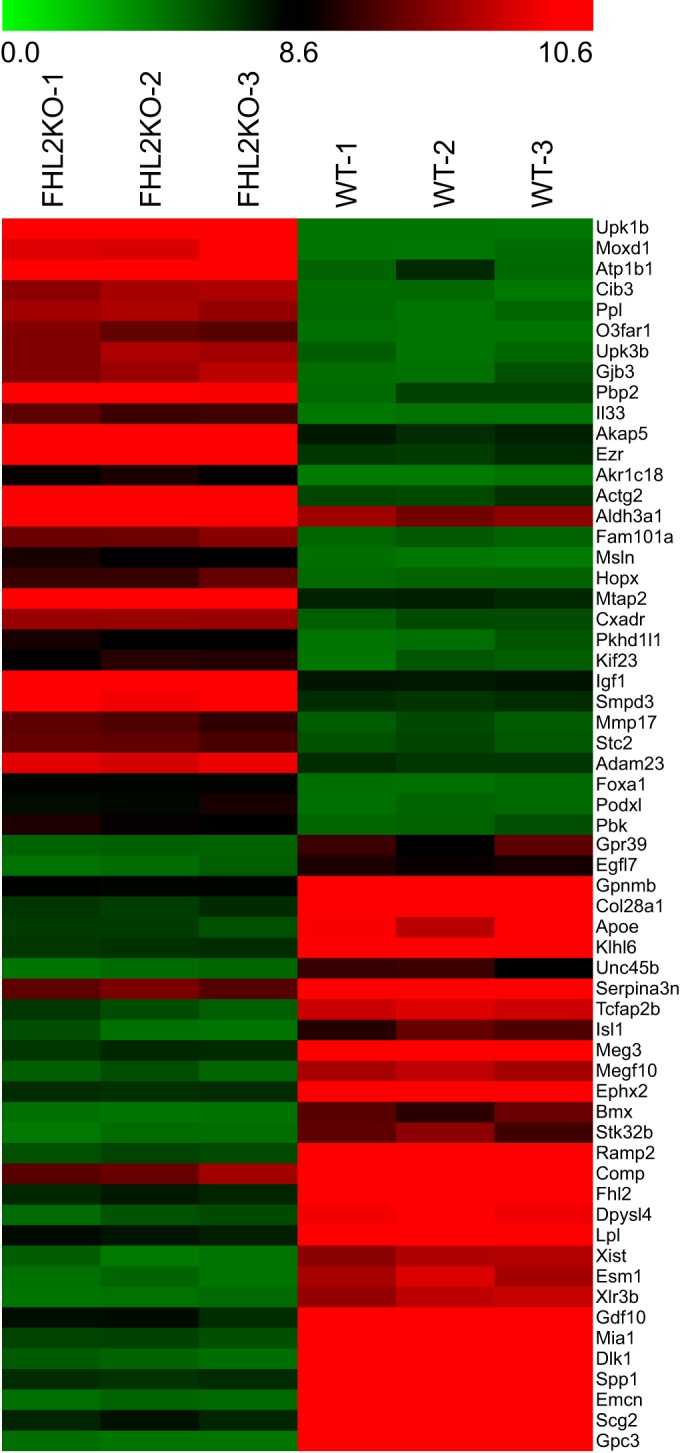
FIG 1.

Changes in mRNA abundance in FHL2-KO compared to WT SMCs, as determined by microarray analysis. This heat map shows the top 30 up- and downregulated genes in FHL2-KO compared with WT SMCs. Green indicates downregulation, and red indicates upregulation.
