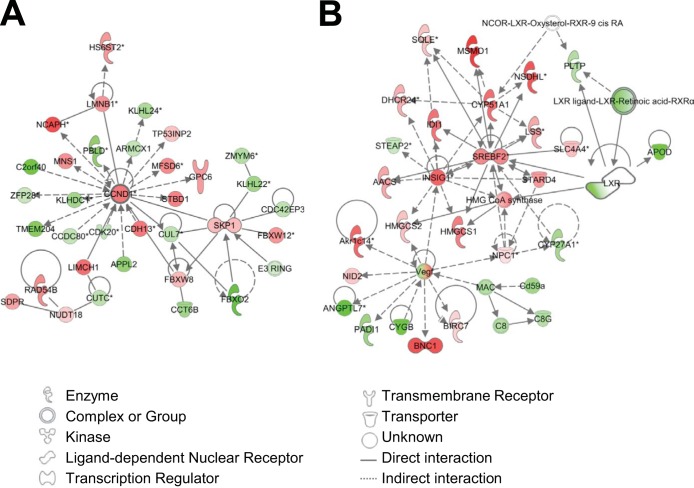
FIG 2.
Network analysis of the expression profiles of WT and FHL2-KO SMCs. Data analyses revealed that networks related to cell cycle regulation (A) and lipid metabolism (B) are affected by FHL2 deficiency. Interactions between genes are shown as explained in the legend. Red symbols indicate that genes are upregulated in FHL2-KO SMCs compared to WT cells, green symbols indicate downregulation of genes, and white indicates proteins with unchanged expression.

