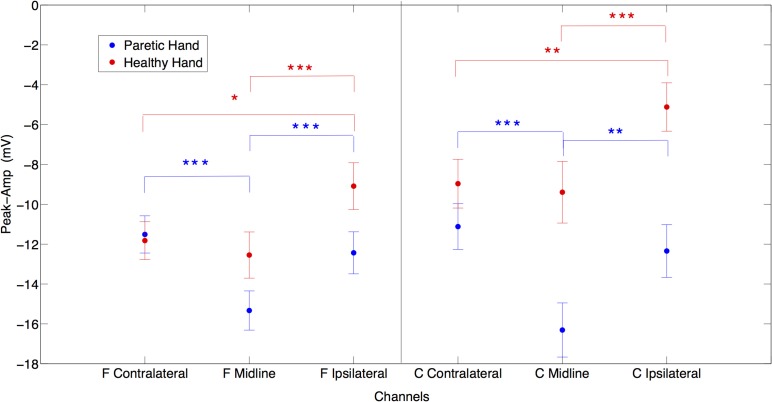
Figure 2.
The laterality effects on peak amplitudes in μV for both paretic (in blue) and healthy (in red) hand movements. X axis represents frontal contralateral (F contra), frontal midline (F mid), frontal ipsilateral (F ipsi) and central contralateral (C contra), central midline (C mid), central ipsilateral (C ipsi) channels. (*p = 0.05; **p = 0.01; ***p = 0.001) (Error bars represent the standard error).

