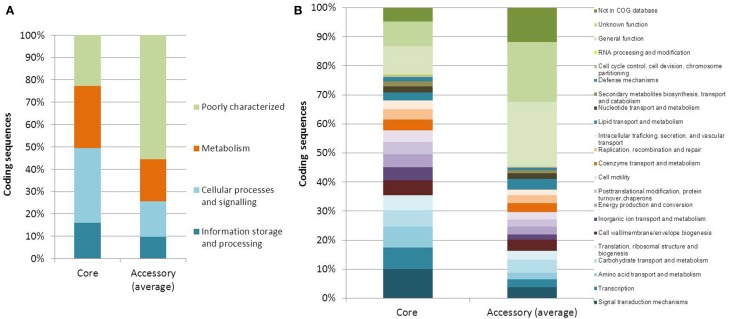
Figure 2.
Functional annotations of core and accessory genes. (A) COG categories and (B) COG subcategories of predicted genes within the core and accessory genomes of V. vulnificus. Each category or subcategory is graphed as a percentage of the total number of genes in the core or accessory genomes. Accessory genome percentages are averages of the 16 analyzed genomes.

