FIGURE 1.
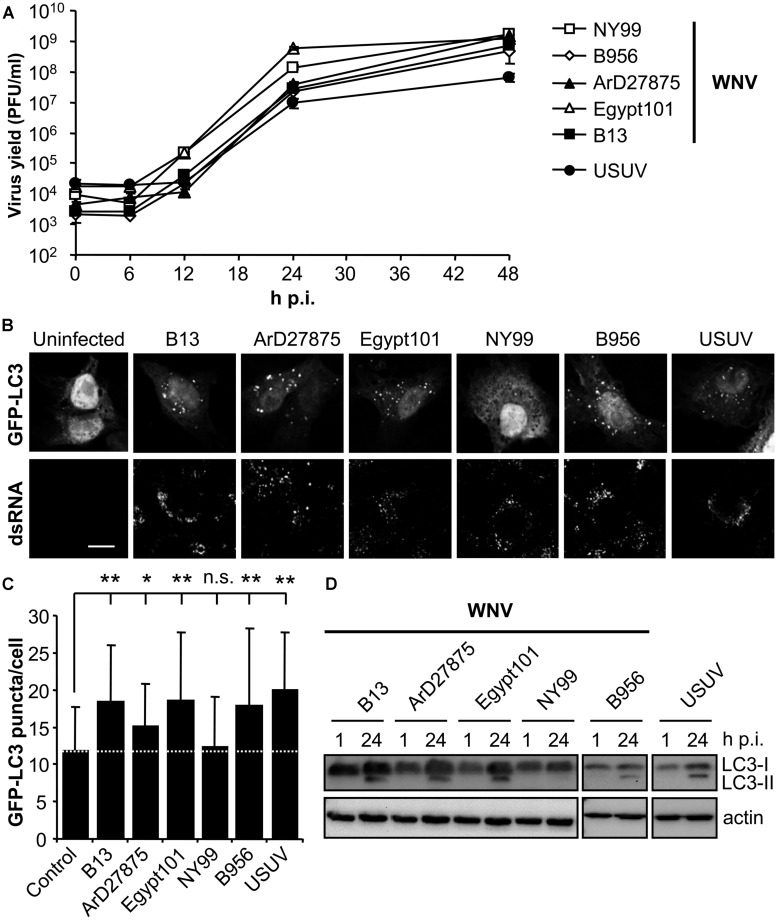
Differences on the induction of LC3 modification and aggregation in cells infected with diverse variants of West Nile virus (WNV). (A) Growth curves of WNVs in Vero cells. Cells were infected (MOI of 0.5 PFU/cell) with WNVs (B13, B956, ArD27875, Egypt101, and NY99) or USUV and supernatant virus yield was determined at different times p.i. by standard plaque assay on Vero cells. (B) Visualization of autophagosome formation by LC3 aggregation in cells infected with the viruses displayed in panel (A). Vero cells were transfected with a plasmid encoding GFP-LC3 and 24 h post-transfection were infected with WNV or USUV (MOI of 5 PFU/cell). Cells were fixed and processed for immunofluorescence using a monoclonal antibody against dsRNA and secondary antibodies AF-594 labeled 24 h p.i. Scale bars: 10 μm. (C) Quantification of the number of LC3 aggregates per cell. The number of fluorescent aggregates on the cytoplasm of cells infected in (B) was determined. Dashed line indicates the mean number of GFP puncta aggregates found in uninfected cells. Statistically significant differences between infected and uninfected cells are denoted by one asterisk (*) for P < 0.05 or two asterisks (**) for P < 0.005. n.s. denotes not statistically significant differences. (D) Monitoring LC3 modification following infection by WNV or USUV. Vero cells infected with different WNVs or USUV (MOI of 0.5 PFU/cell) were lysed at 1 or 24 h p.i. and subjected to western blot analysis using an antibody against LC3 to detect non-lipidated LC3 (LC3-I) and LC3 conjugated to phosphatidylethanolamine (LC3-II). An anti-β-actin antibody was also used as control for protein loading.

