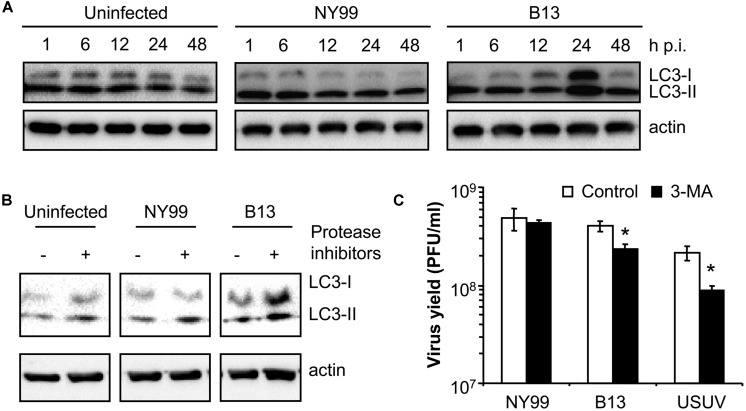
FIGURE 2.
Characterization of the differences between WNV NY99 and B13 variant. (A) Time course analysis of LC3 modification following infection by WNV NY99 or B13. Vero cells infected with WNV NY99 or B13 (MOI of 0.5 PFU/cell) were lysed at 1, 6, 12, 24, or 48 h p.i. and subjected to western blot analysis using an antibody against LC3 to detect non-lipidated LC3 (LC3-I) and LC3 conjugated to phosphatidylethanolamine (LC3-II). An anti-β-actin antibody was also used as control for protein loading. Mock-infected cells were analyzed in parallel to show the levels of LC3-II in uninfected cells. (B) Analysis of LC3 modification following infection by WNV NY99 or B13 including protease inhibitors (E-64d and pepstatin A). Vero cells were infected with WNV NY99 or B13 (MOI of 5 PFU/cell) and harvested at 24 h p.i. Protease inhibitors E-64d and pepstatin A (10 μg/ml each) were added to culture medium 4 h before harvesting the cells. Mock-infected cells were analyzed in parallel to show the effect of inhibitors in uninfected cells. Western blot analysis was performed as described for panel A. (C) Effect of pharmacological inhibition on the infection of WNV NY99 and B13. Cells infected with the different viruses (MOI of 0.5 PFU/cell) were treated with 2.5 mM 3-MA and the virus yield were determined by plaque assay at 24 h p.i. USUV was included as a positive control. Statistically significant differences between each condition and control cells are denoted by one asterisk (*) for P < 0.05.

